What is ExplaGraphs?
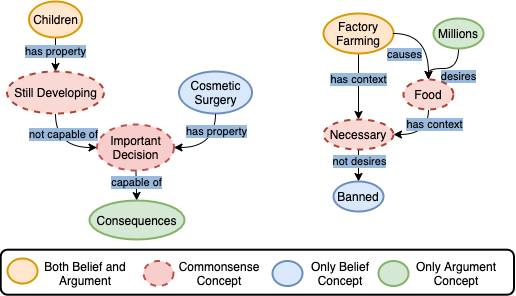
ExplaGraphs is a generative and structured commonsense reasoning task of generating explanation graphs for stance prediction. For a belief about a popular debate topic and an argument either supporting or refuting the belief, ExplaGraphs contains the corresponding commonsense-augmented explanation graphs that serve as non-trivial, complete, and unambiguous explanations for the stance. It is collected by a team of NLP researchers at UNC Chapel Hill.
For more details about ExplaGraphs, please refer to our EMNLP 2021 paper:
Getting started
ExplaGraphs is distributed under a CC BY-SA 4.0 License. The training and development sets can be downloaded below.
To evaluate your model on the test set, please send us your send us your predictions at swarna@cs.unc.edu. Based on your interest, we can add your model's results to the leaderboard as well. Please refer to the sample prediction format below. Note that each line in the predictions file should contain two tab-separated entries, first the stance prediction followed by the explanation graph. The graph should be represented in the form of concatenated edges as in the original train and dev splits. Please refer to the sample prediction file below.
Evaluation
Our paper proposes a evaluation pipeline in Section 6, consisting of three levels. In the first level, we evaluate for stance correctness. In the next level, we compute the accuracy of structurally correct graphs. Note that this requires that all the constraints we define in our paper be exactly satisfied for an explanation graph to be valid. You should not look to boost up this accuracy by some arbitrary post-hoc correction of structurally incorrect graphs (like adding a random edge to make a disconnected graph connected). A systematic way to incorporate constraints in the model (similar to our structured model) is, however, fine. Finally, in the last level, we take the structurally correct graphs and evaluate for semantic correctness and various graph matching metrics. Please refer to the evaluation scripts below.Citation
If you use ExplaGraphs in your research, please cite our paper with the following BibTeX entry
@inproceedings{saha2021explagraphs,
  title={{ExplaGraphs}: An Explanation Graph Generation Task for Structured Commonsense Reasoning},
  author={Saha, Swarnadeep and Yadav, Prateek and Bauer, Lisa and Bansal, Mohit},
  booktitle={EMNLP},
  year={2021}
}
| Model | Code | SeCA↑ | SA↑ | StCA↑ | GBS↑ | GED↓ | EA↑ | |
|---|---|---|---|---|---|---|---|---|
| - Sept, 2021 |
Human UNC Chapel Hill (Saha, et al. 2021) |
- | 83.5 | 91.0 | 91.0 | 71.1 | 0.38 | 46.8 |
| 1 April, 2022 |
Max-Margin GraphGen UNC Chapel Hill (Saha, et al. 2022) |
43.5 | 87.2 | 56.7 | 48.6 | 0.57 | 30.5 | |
| 2 April, 2022 |
Contrastive GraphGen UNC Chapel Hill (Saha, et al. 2022) |
42.5 | 87.2 | 60.5 | 52.1 | 0.52 | 33.1 | |
| 3 April, 2022 |
T5-Large UNC Chapel Hill (Saha, et al. 2022) |
34.7 | 87.2 | 51.0 | 43.9 | 0.61 | 29.5 | |
| 3 July, 2022 |
Anonymous Anonymous |
- | 31.2 | 87.7 | 50.7 | 43.8 | 0.62 | 27.7 |
| 4 Sept, 2021 |
Baseline Model (RE-SP) UNC Chapel Hill (Saha, et al. 2021) |
20.0 | 72.5 | 62.5 | 50.0 | 0.60 | 26.2 | |
| 5 Sept, 2021 |
Baseline Model (RA-T5) UNC Chapel Hill (Saha, et al. 2021) |
19.0 | 87.2 | 38.7 | 33.6 | 0.71 | 20.8 | |
| 6 Sept, 2021 |
Baseline Model (RE-T5) UNC Chapel Hill (Saha, et al. 2021) |
13.5 | 69.0 | 32.5 | 28.3 | 0.75 | 17.3 |